DrugComb Documentation
Introduction
- Name : DrugComb portal
- Version : v 1.1
- Developers : Network Pharmacology for Precision Medicine group, University of Helsinki
- Group Leader : Dr. Jing Tang
This documentation is a user manual for DrugComb data portal. If you have any questions after going through it, feel free to contact the group leader Dr. Jing Tang on jing.tang@helsinki.fi or reach us using the ”Feedback” button directly on the website. Note: the second option might require disabling your adblock extension in the browser.
Requirements
It is suggested to use any modern web browser with Javascript enabled. Functionality is guaranteed under Google Chrome version 59 and above, as well as Mozilla Firefox version 50 and above. The website is not thoroughly tested under Safari.
It is recommended to use Google Chrome and Mozilla Firefox. The website is not tested under Safari
Getting Started #back to top
DrugComb is an integrated data portal aimed at collecting, analysing and distributing the results of drug combination screens on cancer cell lines. Its main purpose is harmonisation of drug combination research results. Due to various experimental methodologies used in drug combination studies under the umbrella of personalised anticancer research, it is often problematic to integrate compound screening results from different studies. Various definitions of drug synergy used by researchers exacerbate the issue. As a result, in addition to scientifically challenging task of explaining and predicting effective drug combinations, researchers in the field end up having to invest considerable effort into data preparation and cleaning.
DrugComb data portal provides free access to experimental data for researchers and layperson alike with the purpose of being a unified source of information about drug combination screens. In addition to being a repository containing data from the existing drug combination studies, it allows raw data upload, semi-automated data quality control, calculation and visualisation of drug combination synergy values, dose-response heatmaps, single drug dose-response curves, box plots for CSS, and S score. Third party APIs provide access to STITCH database in order to access chemical-protein association networks between compounds; to PubChem in order to generate molecular structural formulae of compounds; and to ChEMBL for ligand-based target predictions using compounds as input. Future plans include prediction of novel, previously untested drug combinations using machine learning and network-centric tools using drug names and cancer types as input parameters.
User information#back to top
The General Data Protection Regulation 2016/679 of the European Parliament and the Council of the European Union mandates appropriate technical and organizational measures for the purpose of user data protection. Currently, DrugComb portal does store user-submitted data for three days, including cookies and submitted drug combinations data. All the access to data portal’s data is performed over Hypertext Transfer Protocol Secure (https). Bidirectional data encryption protects sensitive user data from man-in-the-middle attacks. In the future, there will be an option to create user accounts for the purpose of session storage, customized analysis pipelines and data view settings.
Drug synergy #back to top
Drug synergy is a dimensionless measure of drug-drug interaction. It assesses the degree of deviation of an observed response from the null hypothesis, that is an expected effect of non-interaction. Different mathematical models have different definitions of what synergy is, which results in varying synergy values for the same drug and cell line combination. In DrugComb data portal synergy is calculated using four different reference models:
-
● Bliss model [Bliss, 1939] assumes a stochastic process in which two drugs elicit their effects independently, and
the expected combination effect can be calculated based on the probability of independent events as:
\begin{equation} \label{eq:1} y_{BLISS}=y_1+y_2-y_1*y_2 \\ \end{equation} where $$y_{1,2} \in [0,1]$$ are single drug effects measured as fractional cell death or cell growth
- ● Highest Single Agent (HSA) [Berenbaum, 1989] states that the expected combination effect equals to the higher effect of individual drugs: $$yHSA = max(y1, y2).$$
-
● Loewe additivity model [Loewe, 1953] defines the expected effect yLOEW E as if a drug was combined with itself.
Unlike the HSA and the Bliss independence models giving a point estimate using different assumptions, the
Loewe additivity model considers the dose-response curves of individual drugs. The expected effect yLOEWE
must satisfy:
\begin{equation} \label{eq:3} \frac {x_1}{\chi_{LOEWE}^1} + \frac{x_2}{\chi_{LOEWE}^2} = 1 \end{equation} where $$x_{1,2}$$ are drug doses and $$\chi_{LOEWE}^1, \chi_{LOEWE}^2$$ are the doses of drug 1 and 2 alone that produce y_LOEWE. Using 4-parameter log-logistic (4PL) curves to describe dose-response curves the following parametric form of equation 3 is derived:
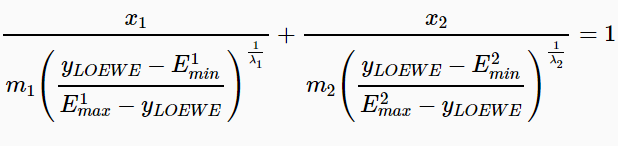 where $$E_{min},E_{max} \in [0,1]$$ are minimal and maximal effects of the drug, $$m_{1,2}$$ are the doses of drugs that produce the midpoint
effect of $$E_{min} + E_{max}$$, also known as relative $$EC_{50}$$ or $$IC_{50}$$, and
$$\lambda_{1,2}(\lambda > 0)$$are
the shape parameters indicating the sigmoidicity or slope of dose-response curves. A numerical nonlin-
ear solver (such as index.htmlfor R or
optimize.nonlin.html for Python) can be then used to determine yLOEWE for (x1, x2).
where $$E_{min},E_{max} \in [0,1]$$ are minimal and maximal effects of the drug, $$m_{1,2}$$ are the doses of drugs that produce the midpoint
effect of $$E_{min} + E_{max}$$, also known as relative $$EC_{50}$$ or $$IC_{50}$$, and
$$\lambda_{1,2}(\lambda > 0)$$are
the shape parameters indicating the sigmoidicity or slope of dose-response curves. A numerical nonlin-
ear solver (such as index.htmlfor R or
optimize.nonlin.html for Python) can be then used to determine yLOEWE for (x1, x2).
-
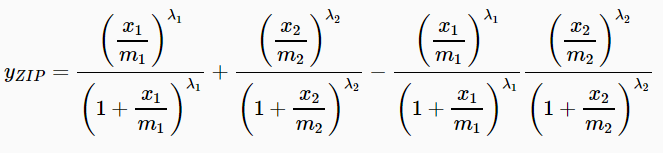
● Zero Interaction Potency (ZIP) [Yadav et al., 2015] calculates the expected effect of two drugs under the
assumption that they do not potentiate each other:
Drug combination sensitivity #back to top
CSS - drug combination sensitivity score is derived using relative IC50 values of compounds and the area under
their dose-response curves. AAC [Yang et al., 2013] and DSS [Yadav et al., 2014] metrics have been used as an
inspiration for the CSS derivation. CSS of a drug combination is calculated such that each of the compounds is used
at a fixed concentration (background drug) and another is at varying concentrations (foreground drug) resulting
in two CSS values, which are then averaged. Each drug’s dose-response is modelled using 4-parameter log-logistic
curve, such that:
\begin{equation}
y = y_{min} + \frac{y_{max} - y_{min}}{1+10^{\lambda{(log_{10} IC_{50}- x')}}}
\end{equation}
where $$y_{min},y_{max}$$ are minimal and maximal inhibition and $$x'=\log_{10} x$$
The area under the log-scaled dose-response curve (AUC) is then determined according to
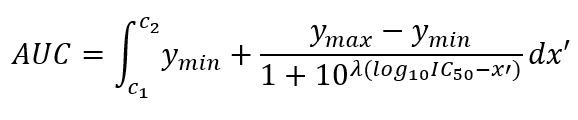 where $$[c_1,c_2]$$ is the concentration of the foreground drug tested [Malyutina et al., 2019].
Data portal Interface #back to top
DrugComb data portal provides access to an ever-growing number of drug combinations. At the moment of writing there is 2276 unique drugs, 93 cell lines representing 10 tissues and over 430k unique drug combinations obtained from four different studies. Please see "Studies as data sources" section for more information on the studies used.
Upon initial access user is informed about the data statistics of DrugComb, including the number of drugs, the number of cell lines, the number of tissue types and the number of drug combinations. We considered a drug combination as an experiment where a drug combination has been tested with multiple doses on a certain cell line, resulting in a dose-response matrix. Therefore, if the same drug combination has been tested in multiple cell lines, each of dose-response matrices will be considered as one drug combination. There is a search bar that allows searching for a specific data type (Cell Line, Tissue, Drug name and Study source).
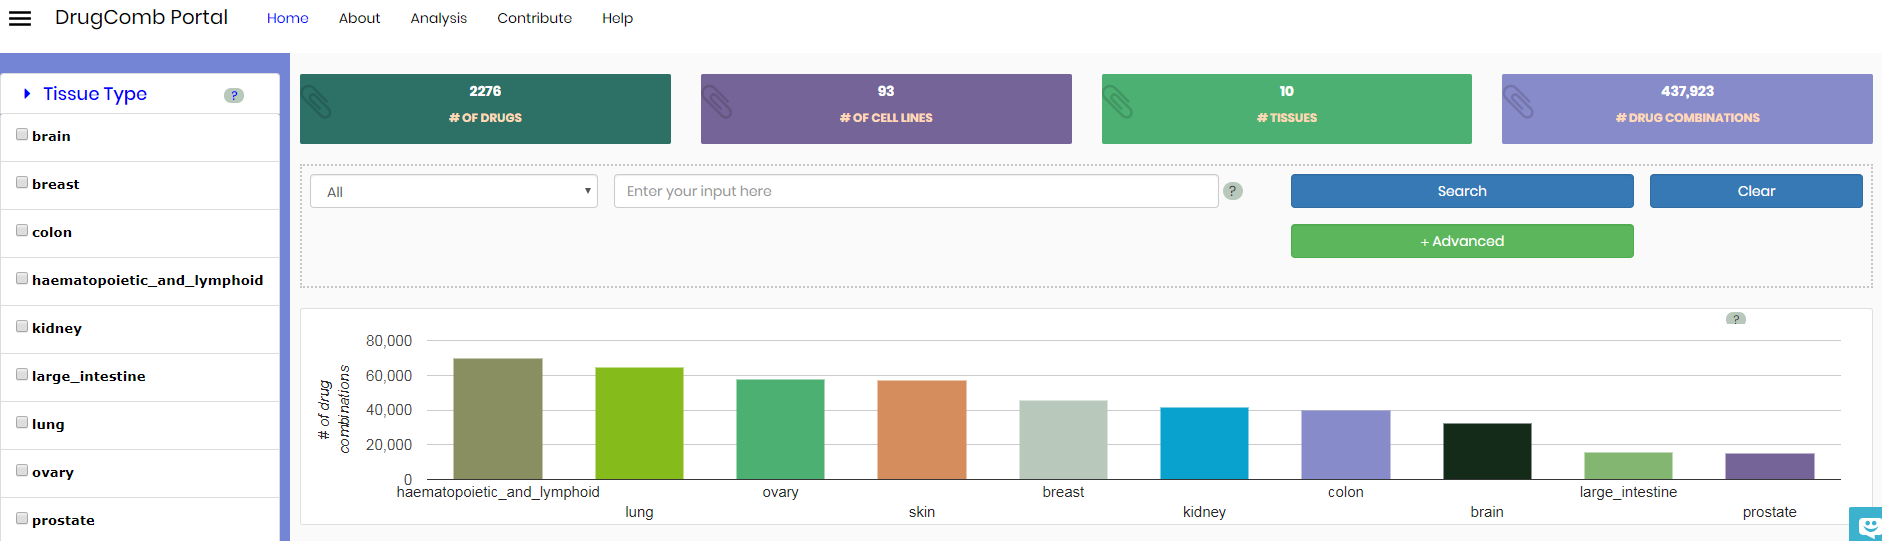
Search is initiated by clicking on the search bar and choosing the initial search category. The following categories are available: Cell line, Tissue, Drug, Study. Category value to include (“=”) or exclude from search (“!=”) should be given sequentially. Different categories could be combined using AND or OR operators. Manual entry of the search string or full text search at the moment of writing is not available.
It is possible to select user-refined categories using the panel on the left side. A histogram gives a visual overview of cell lines and the number of drug combinations per tissue, upon selection this overview gets updated.
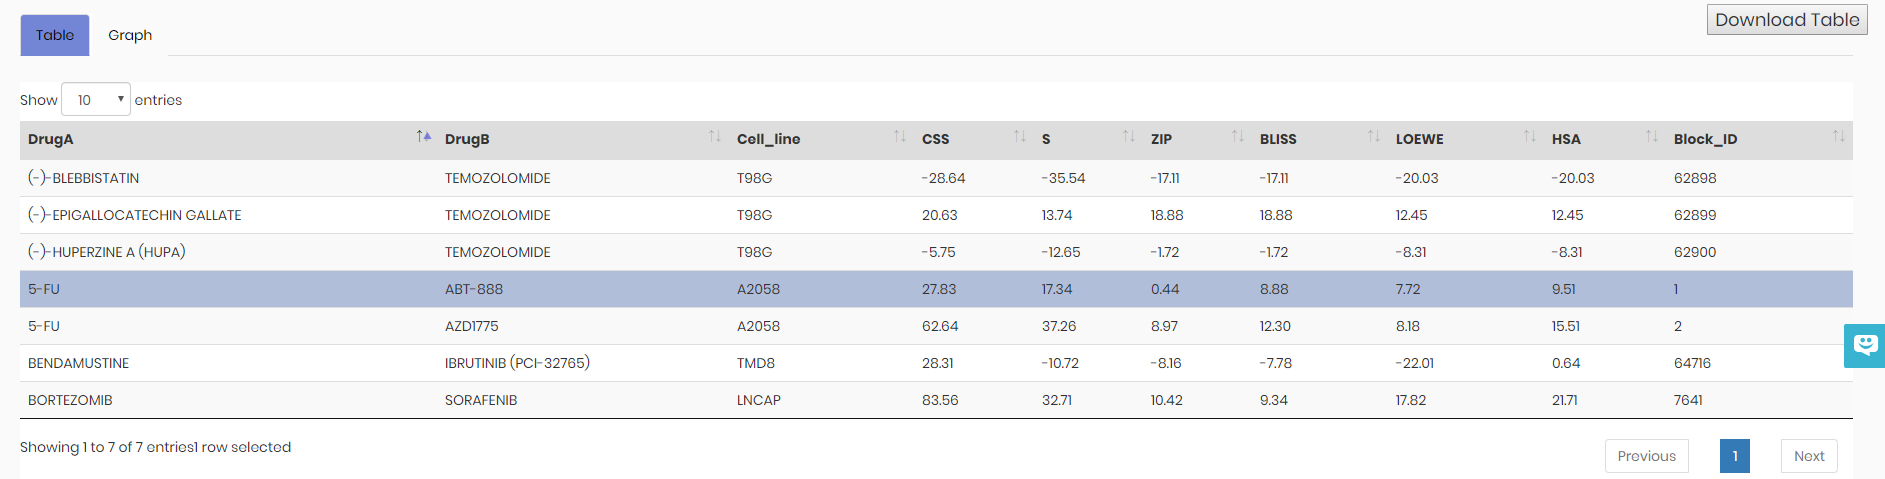
Table view
By default 10 drug combinations are shown on the landing page of the Table tab (see below), however, this number can be increased up to 100 drug combinations per page.
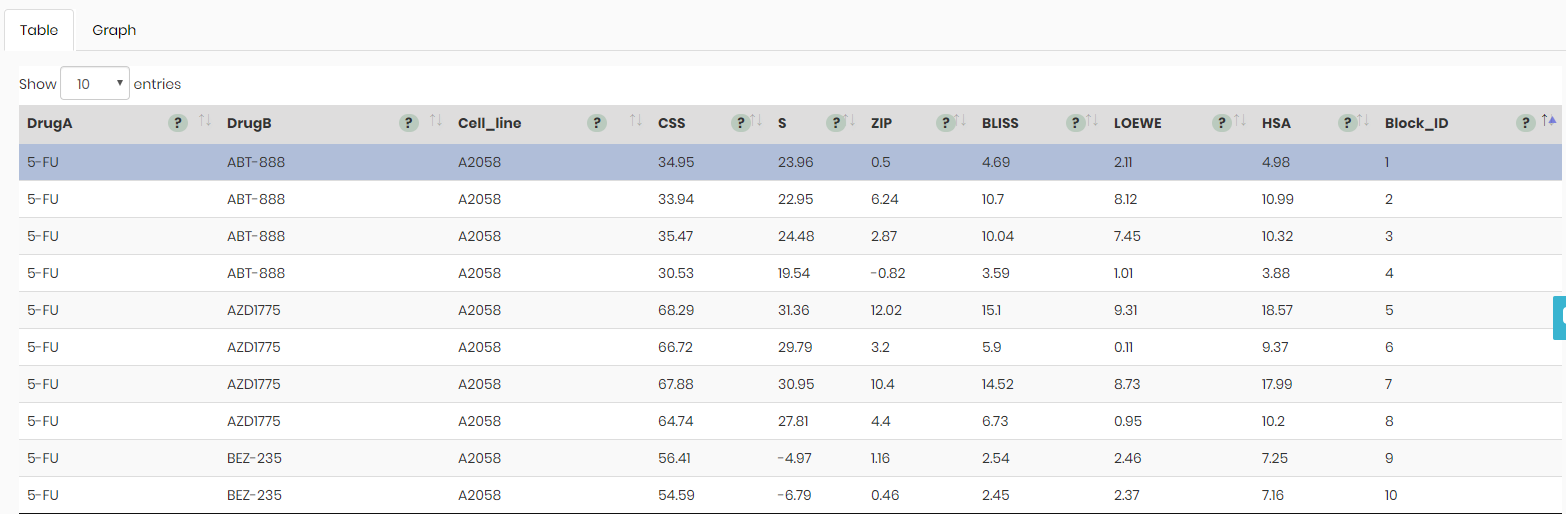
It is possible to sort drug combinations in ascending or descending order using values in any of the columns.
Graph view
When a drug combination is selected, it will be directed to the Graph view which contains the graphical results of sensitivity, synergy and annotation, each of which consists of one sub tabs.
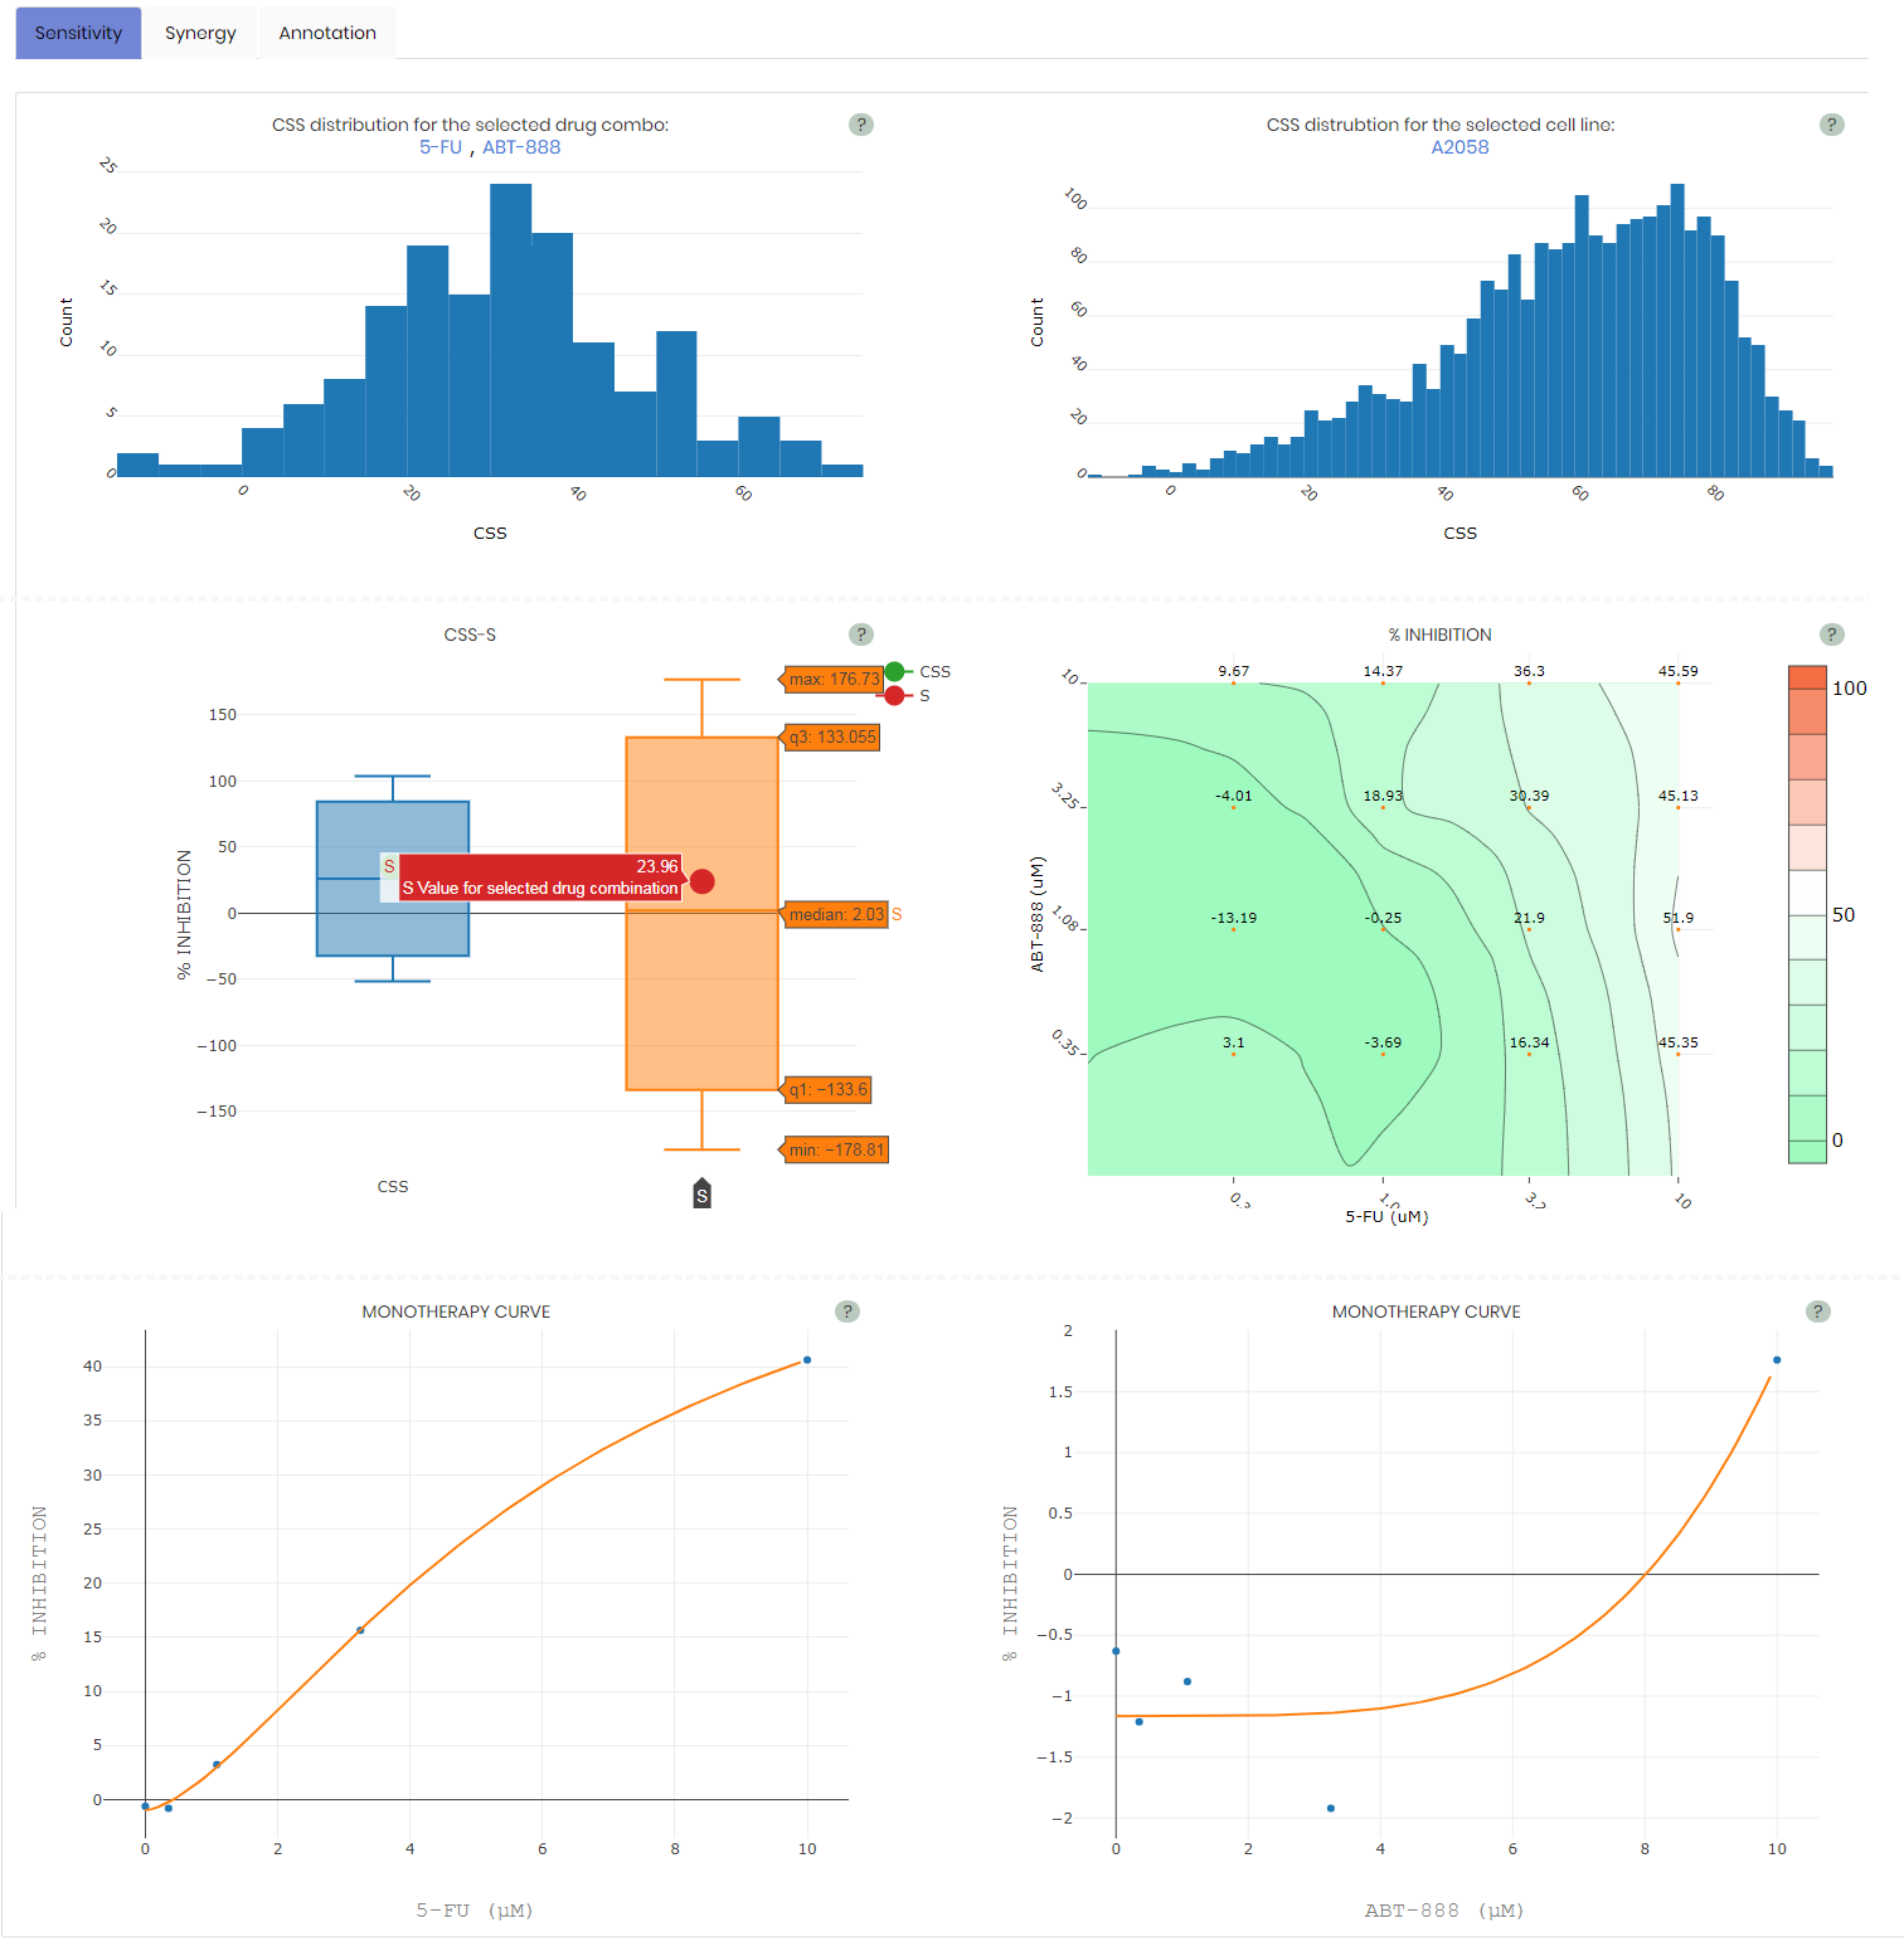
Sensitivity view
It gives access to the graphical results of drug combination sensitivity, including the histogram of the selected drug combinations across all the cell lines, the histogram of the selected cell line across all the drug combinations, the drug combination sensitivity (CSS) - synergy (S) bar plot with the selected drug combination highlighted, the full dose-response matrix and the monotherapy dose-response curves.
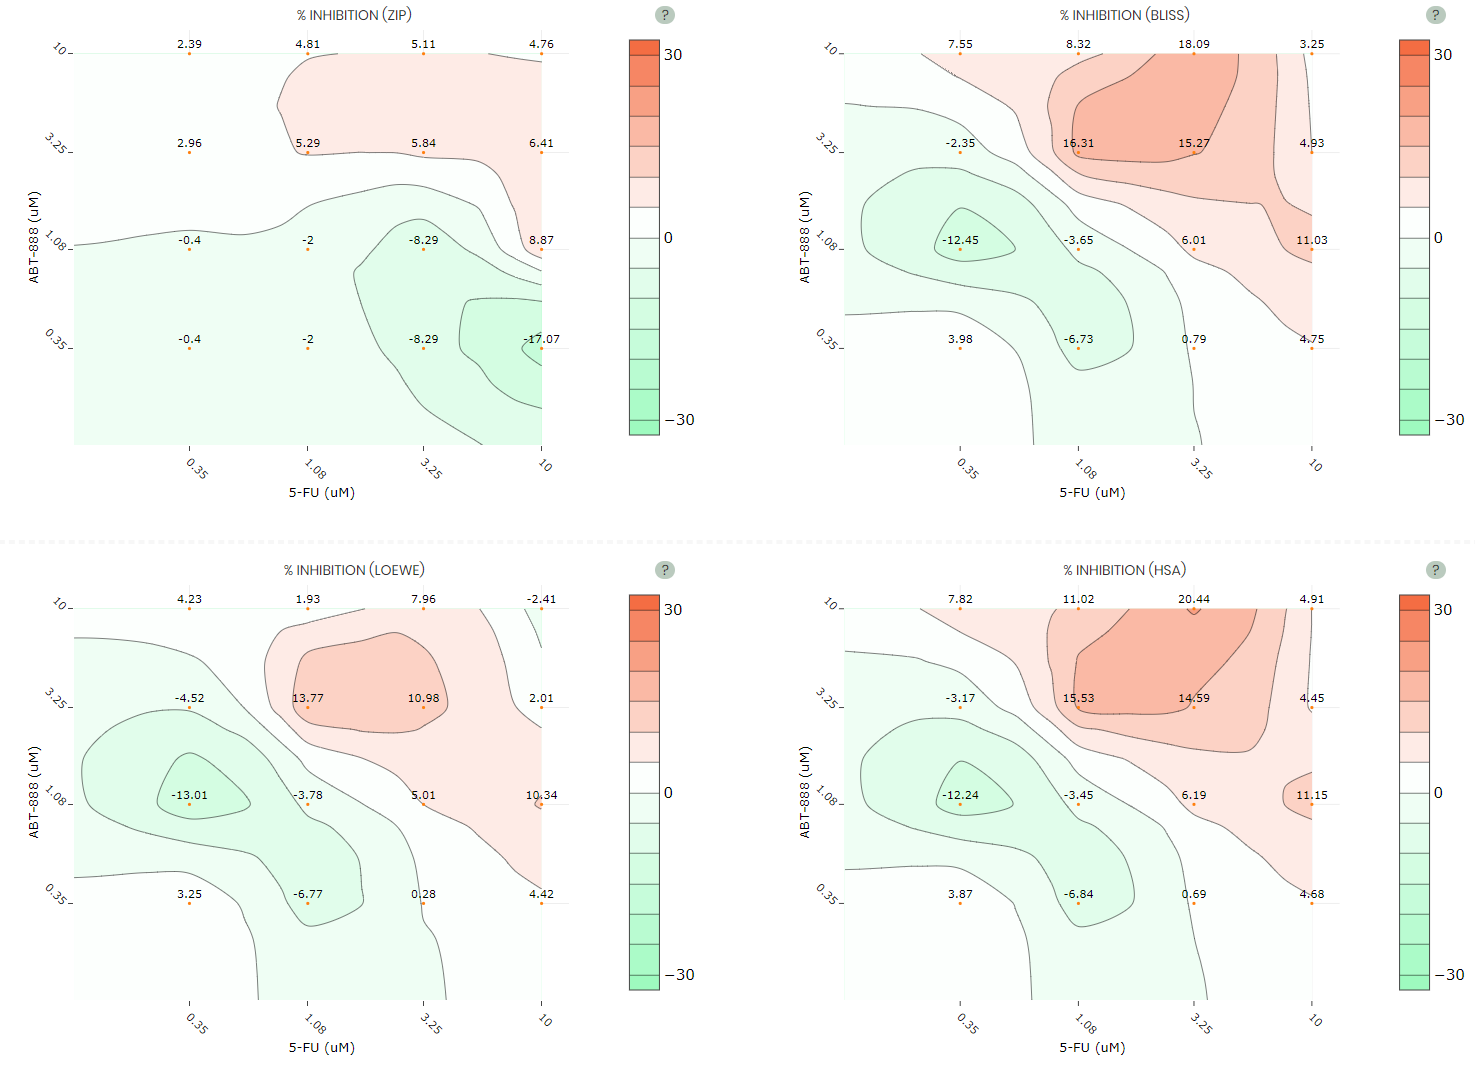
Synergy view
It gives access to the graphical results of drug combination synergy, including the synergy landscapes over the dose matrix that are determined using four mathematical models (ZIP, BLISS, LOEWE and HSA). The synergy scores are in the unit of % inhibition and color-coded in the range of -30 (green) to +30 (red). Higher synergy scores indicate more synergistic interaction that leads to higher % inhibition of cancer cells. See below
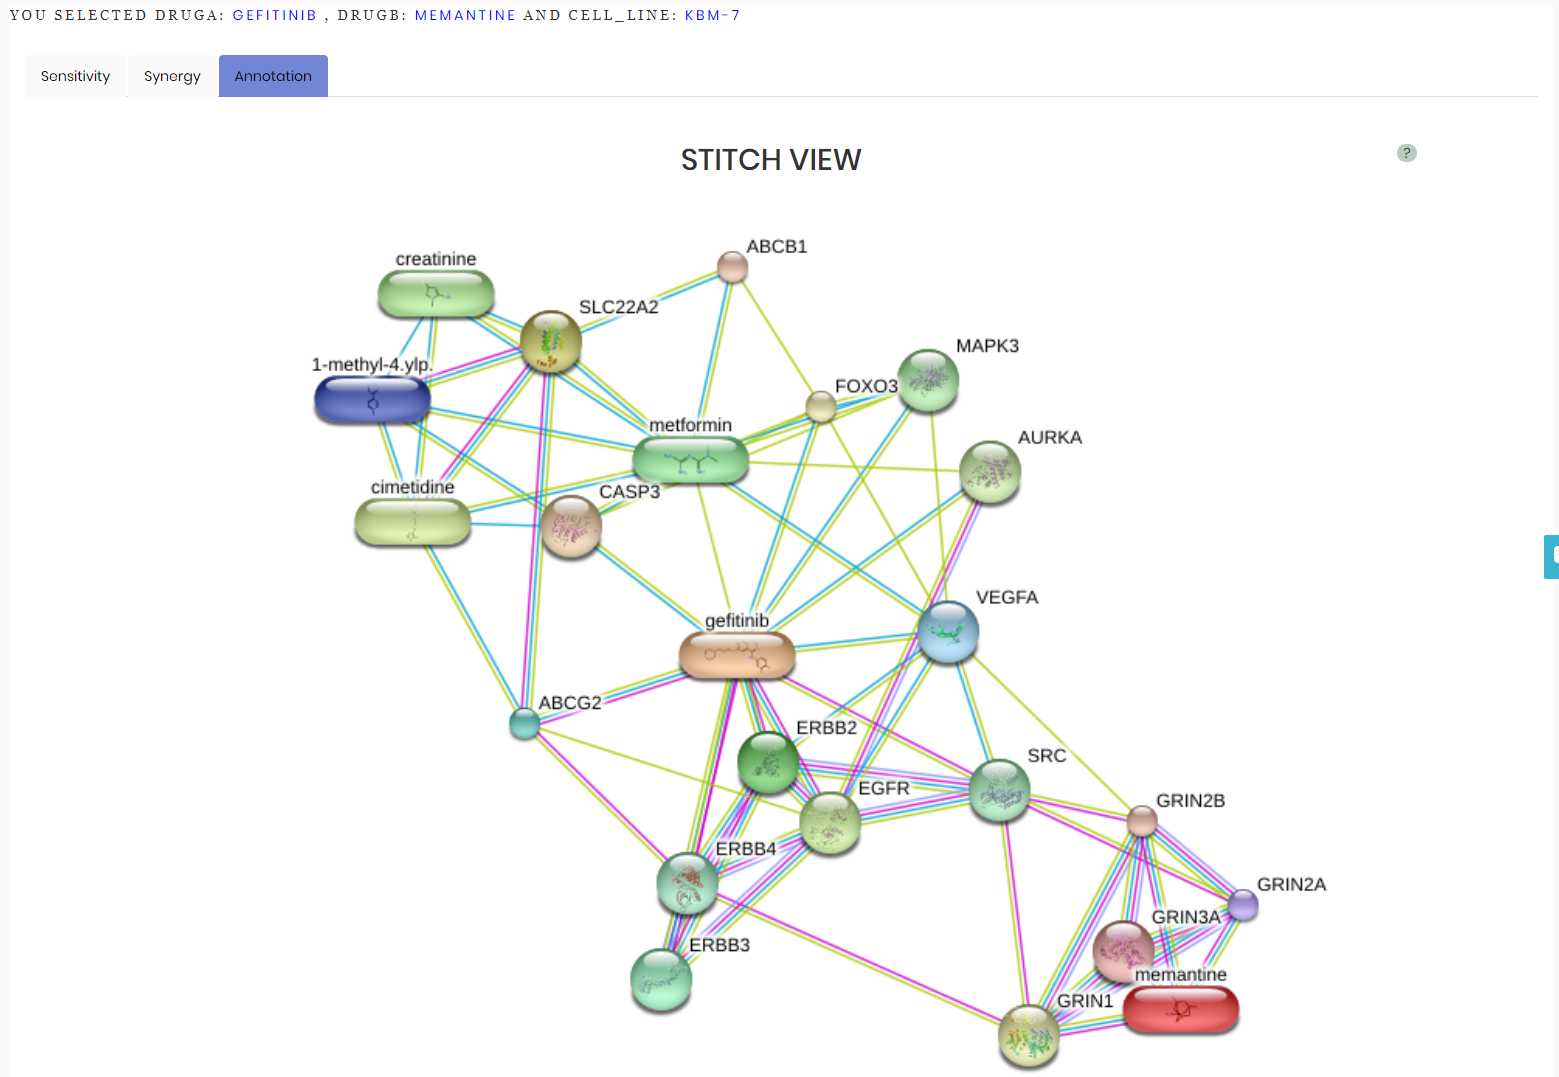
Annotation view
It gives access to annotation of the selected drug combinations in terms of their chemical structures, protein targets and affected biological pathways according to third-party databases including STITCH (http://stitch.embl.de/) , PubChem (https://pubchem.ncbi.nlm.nih.gov/) , and ChEMBL (https://www.ebi.ac.uk/chembl/) STITICH databse is accessed using the following parameters to refine the drug combination network: (edited)
- ● Threshold of significance for the interaction to be displayed (0 to 1000) = 550;
- ● Limit, as max number of nodes to return = 20;
- ● Network flavour = “evidence”, where various colours represent various nature of entities’ interactions;
- ● Species = 9606 for Human, please refer to http://www.uniprot.org/taxonomy for taxa information;
Network generated with the aforementioned parameters for Gefitinib and Memantine is shown below:
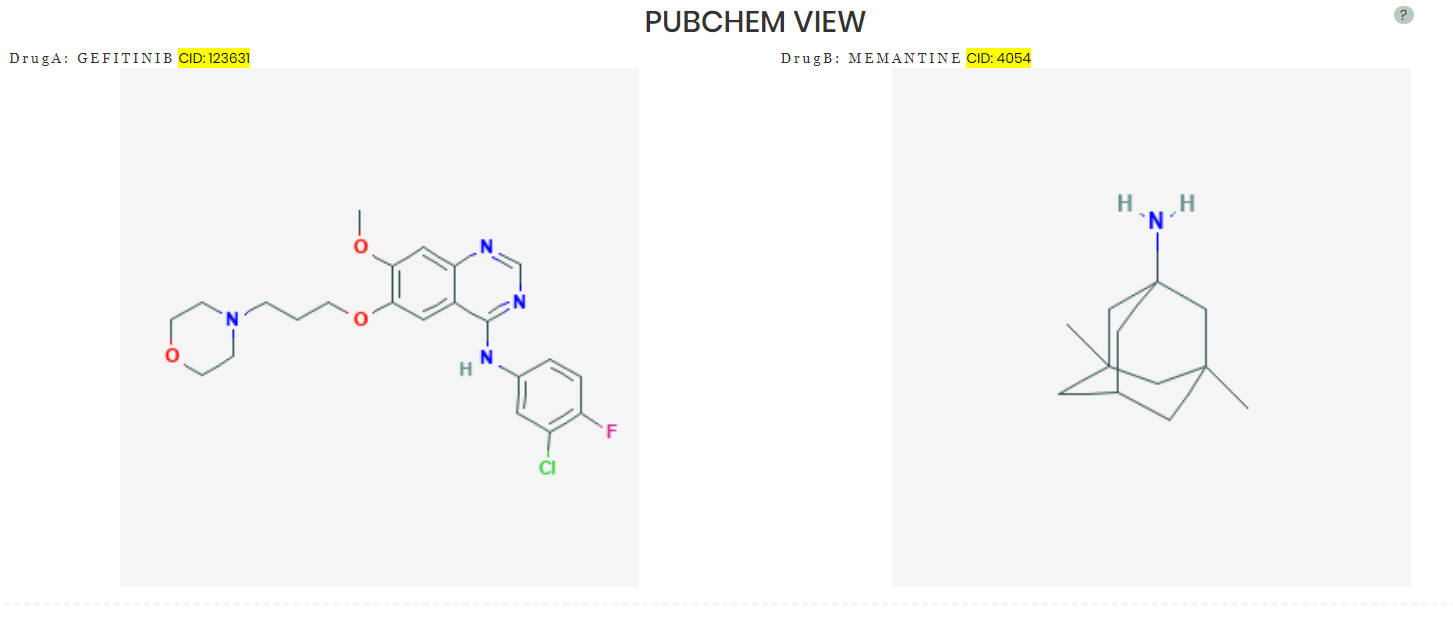
Pubchem view provides the compounds' skeletal formula. More information can be retrieved by the highlighted CID hyperlinks:
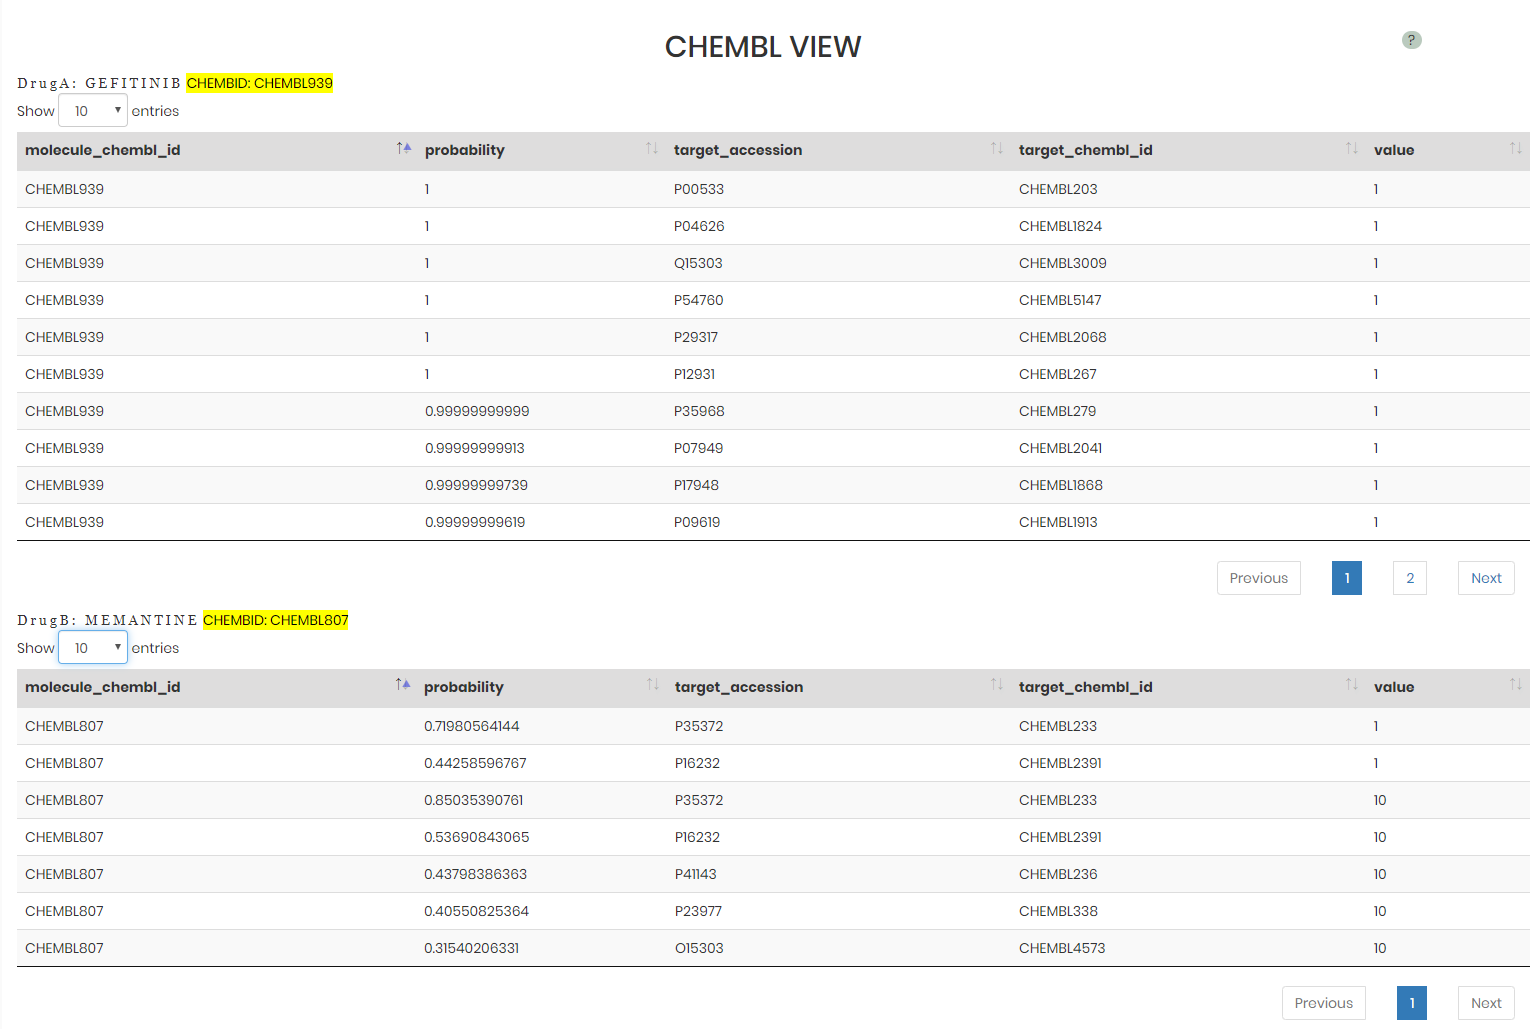
ChEMBL view provides the predicted drug targets with the probability > 0.3. The value column shows the binding affinity in nM. The target_accession column shows the UniProt ID (https://www.uniprot.org/) for the protein target. More information can be retried from ChEMBL via the highlighted ChEMBL IDs.
Example data input #back to top
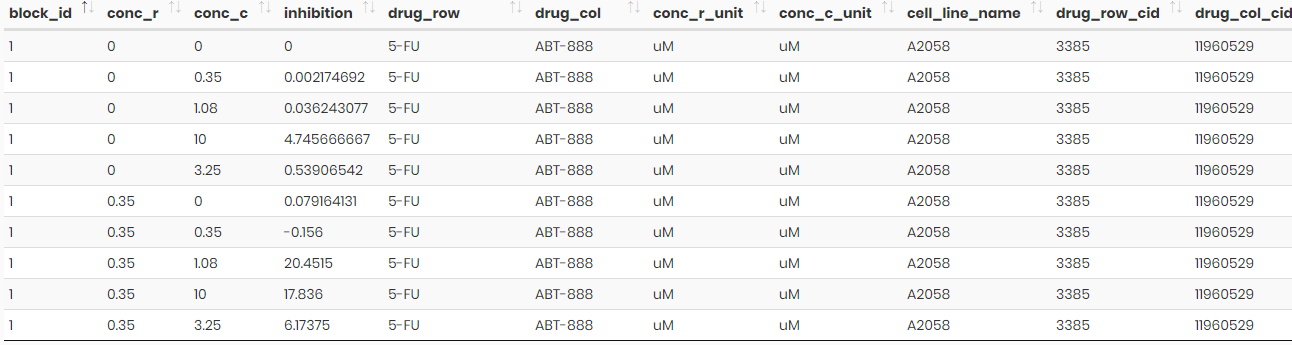
DrugComb data portal provides example data in csv format with the obligatory column naming scheme (case insensitive). The following columns must be present:
- ● Block_id – numerical drug combination ID. Positive integer used to refer to a particular dose-response matrix experiment for a given drug combination-cell pair.
- ● Conc_r – non-negative numerical value. Row compound (DrugA) concentration;
- ● Conc_c – non-negative numerical value. Column compound (DrugB) concentration;
- ● Inhibition – % inhibition values which can be either positive or negative. Negative % inhibition values indicate that the cancer cells grow more than the DMSO control.
- ● Drug_row – standardized name of row compound. Please refer to e.g. https://www.drugbank.ca or https://www.ebi.ac.uk/chembl/ for more information on standardized naming scheme;
- ● Drug_col – standardized name of column compound. Please refer to e.g. https://www.drugbank.ca or https://www.ebi.ac.uk/chembl/ for more information on standardized naming scheme;
- ● Conc_r_unit – micro molar concentration unit of the row compound (DrugA);
- ● Conc_c_unit – micro molar concentration unit of the column compound (DrugB);
- ● Cell_line_name – cell line in which the drug combination is tested. Please refer to https://web.expasy.org/cellosaurus/ for more information on standardized cell line naming scheme;
See example input file below:
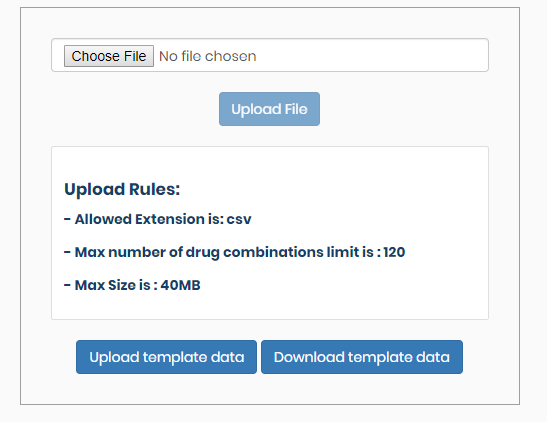
One single upload file of less than 40 MB is allowed, where the number of drug combinations indicated by block_id is maximally 120. For analyzing a bigger input file please contact Dr. Jing Tang (givenname.surname@helsinki.fi).
There is a sample file available as a template under the “Download template data” in the “Analysis” page.
Upon data submission and after pressing “Analyze” button, given that the input data format is correct, four types of synergy values are calculated, namely Bliss, HSA (Highest Single Agent), Loewe and ZIP (Zero Interaction Potency). Additionally, drug combination sensitivity score (CSS) and CSS-based S synergy score are calculated. The results will be shown in the Table tab. See below:
Graph tab provides Sensitivity and Synergy view options. For more information please refer to the Drug synergy and Drug combination sensitivity sections.
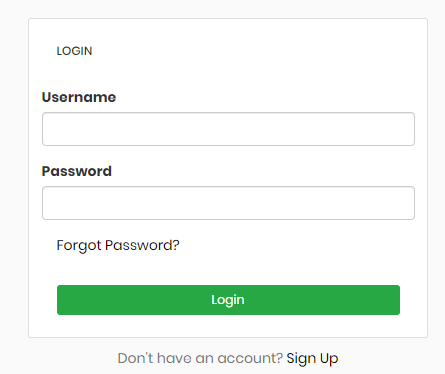
Contributing user data #back to top
User account creation is a prerequisite for contributing combination screening results to DrugComb. There is an option available to create a user account in the DrugComb under ”Contribute” section. The signup requires an email address. After creating a user account it is possible to submit combination drug screening results to be inserted in the DrugComb main database.
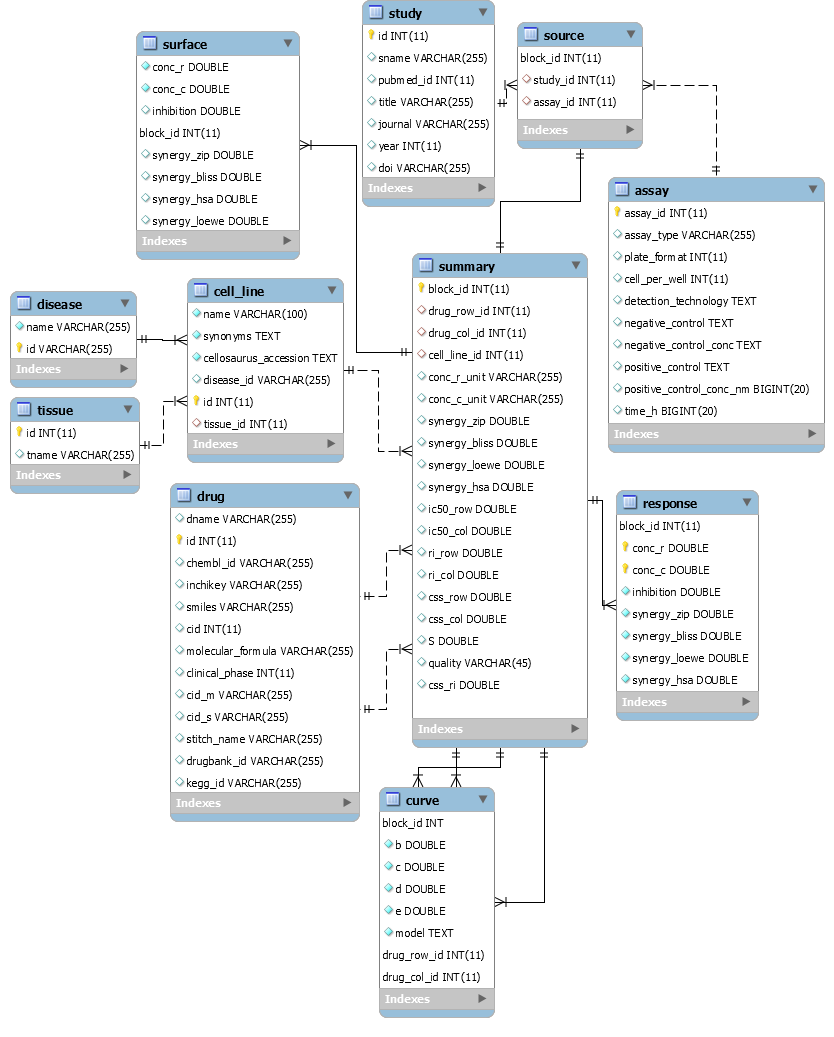
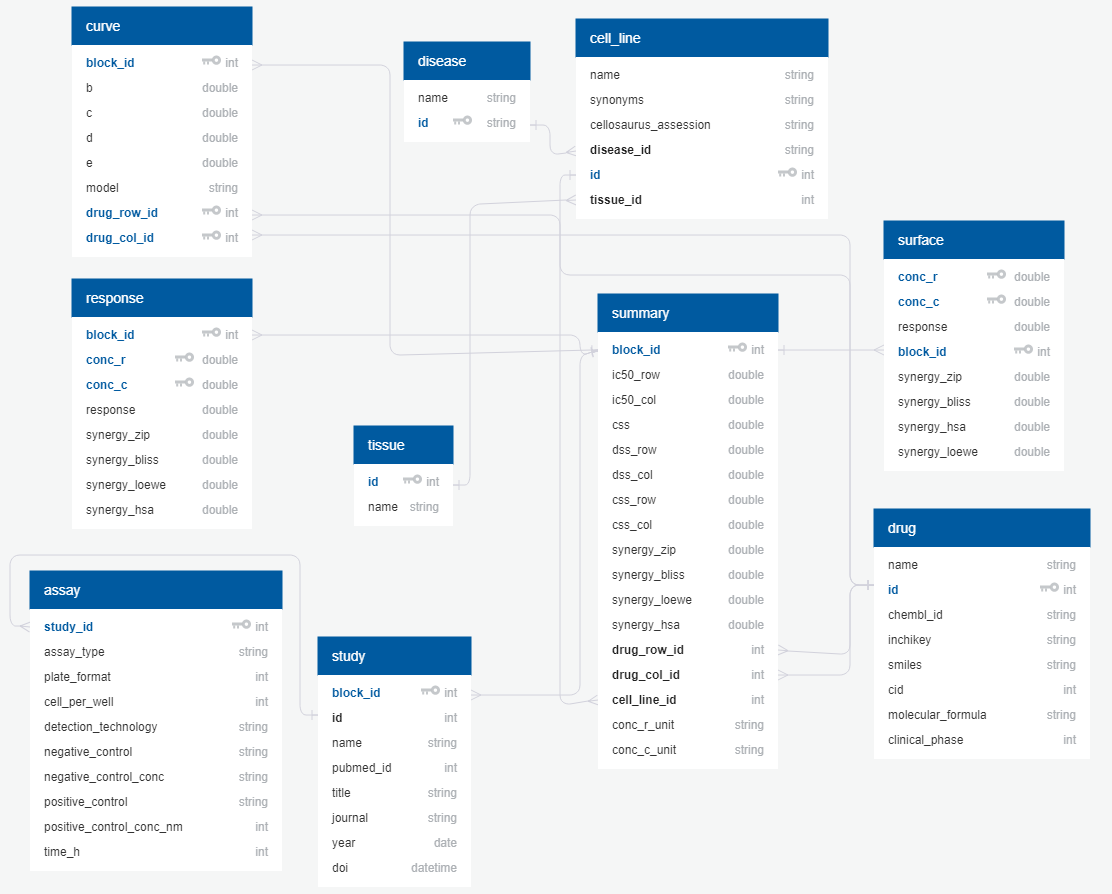
Database structure #back to top
DataBase Schema_V6 [Last Update: 10 Sep. 2019]
Previous Schemas:
--------------------------------------------------
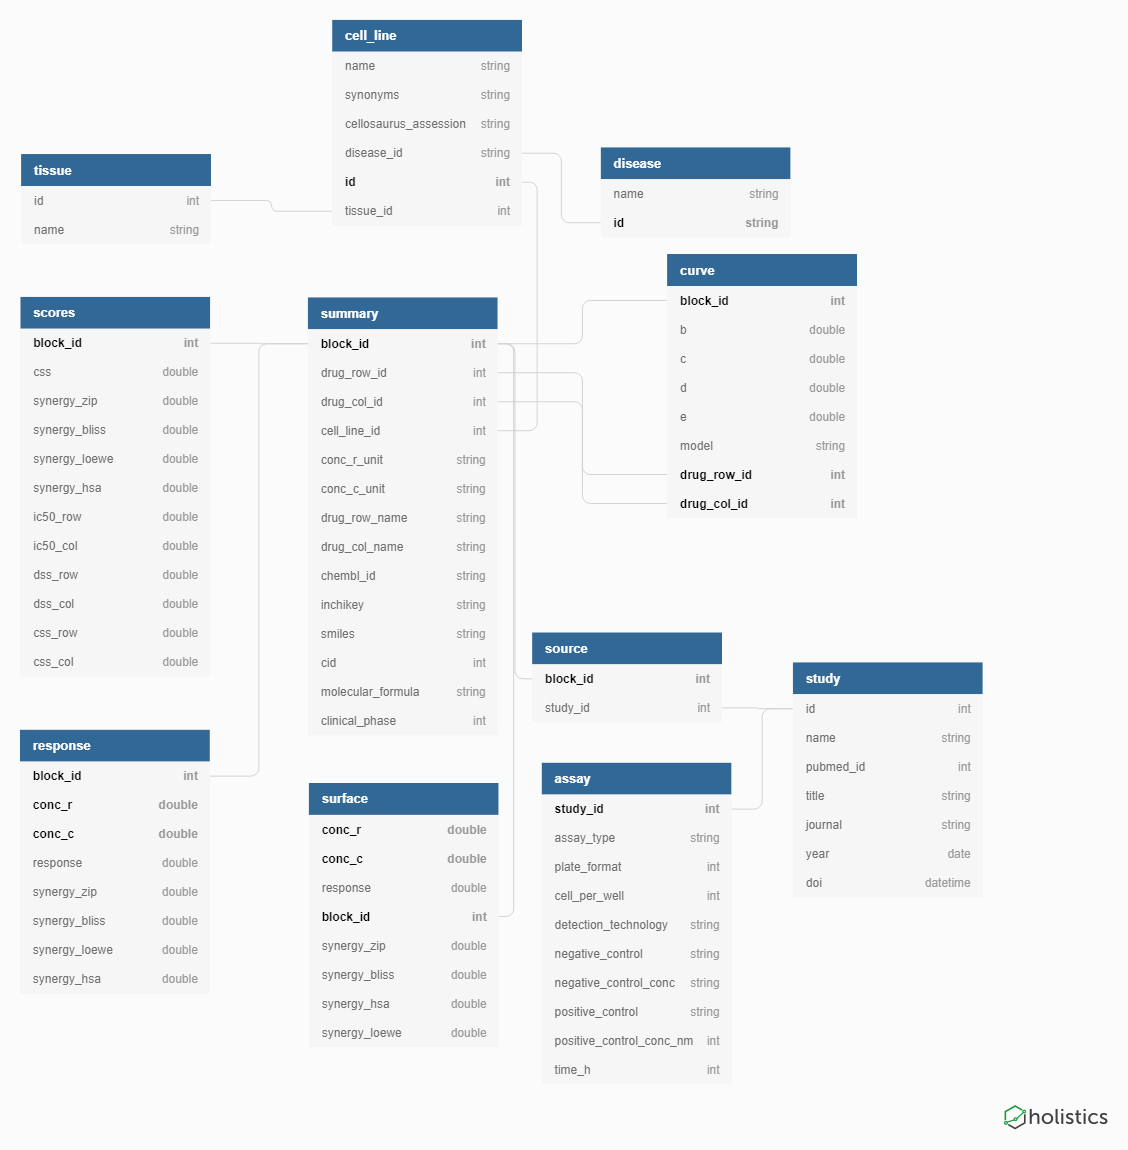
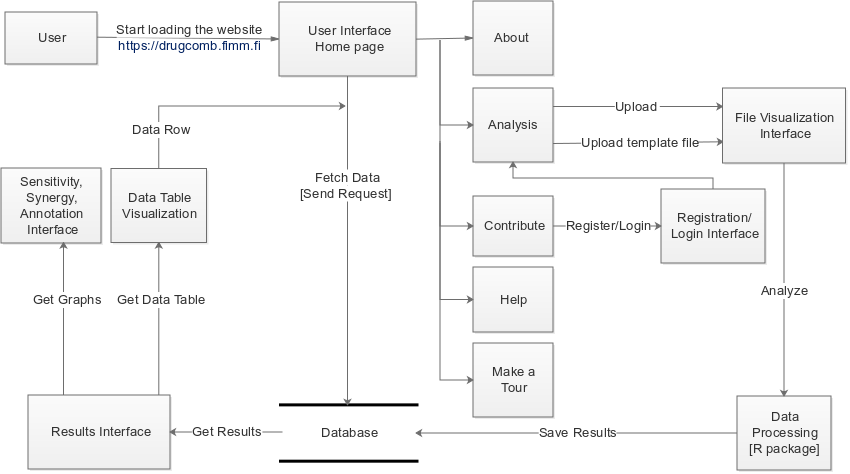
Data flow diagram #back to top
Studies as data sources: #back to top
- ● Forcina et.al. (2017) Systematic Quantification of Population Cell Death Kinetics in Mammalian Cells. Cell Syst. 2017 Jun 28; 4(6): 600–610.e6. 10.1016/j.cels.2017.05.002
- 1819 drugs were screened in 2 cancer cell lines
- ● Holbeck et.al. (2017) The National Cancer Institute ALMANAC: A Comprehensive Screening Resource for the Detection of Anticancer Drug Pairs with Enhanced Therapeutic Activity. , Cancer Res. 2017 Jul 1;77(13):3564-3576. doi: 10.1158/0008-5472.CAN-17-0489
- Over 5000 pairs of FDA-approved cancer drugs are screened against a panel of 60 well-characterized human tumor cell lines (NCI-60) in 3x3 or 5x3 dosing regimen
- ● Licciardello et.al. (2018) A combinatorial screen of the CLOUD uncovers a synergy targeting the androgen receptor. Nat Chem Biol, 10.1038/nchembio.2382
- 308 drugs were screened in 40160 combinations in KBM7 cell line.
- ● O’Neil et.al (2017) An Unbiased Oncology Compound Screen to Identify Novel Combination Strategies. Mol Cancer Ther.;15(6):1155-62. 10.1158/1535-7163.MCT-15-0843. Epub 2016 Mar 16.
- 22737 experiments of 583 doublet combinations in 39 diverse cancer cell lines using a 4x4 dosing regimen.
Bibliography #back to top
- [Berenbaum, 1989] Berenbaum, M. C. (1989). What is synergy? Pharmacol. Rev., 41(2):93–141.
- [Bliss, 1939] Bliss, C. I. (1939). The toxicity of poisons applied jointly1. Annals of Applied Biology, 26(3):585–615.
- [Gaulton et al., 2017] Gaulton, A., Hersey, A., Nowotka, M., Bento, A. P., Chambers, J., Mendez, D., Mutowo, P., Atkinson, F., Bellis, L. J., Cibrian-Uhalte, E., Davies, M., Dedman, N., Karlsson, A., Magarinos, M. P., Overington, J. P., Papadatos, G., Smit, I., and Leach, A. R. (2017). The ChEMBL database in 2017. Nucleic Acids Res., 45(D1):D945–D954.
- [Kim et al., 2016] Kim, S., Thiessen, P. A., Bolton, E. E., Chen, J., Fu, G., Gindulyte, A., Han, L., He, J., He, S., Shoemaker, B. A., Wang, J., Yu, B., Zhang, J., and Bryant, S. H. (2016). PubChem Substance and Compound databases. Nucleic Acids Res., 44(D1):D1202–1213.
- [Loewe, 1953] Loewe, S. (1953). The problem of synergism and antagonism of combined drugs. Arzneimit- telforschung, 3(6):285–290.
- [Malyutina et al., 2019] Malyutina, A., Majumder, M. M., Wang, W., Pessia, A., Heckman, C. A., Tang, J. Drug Combination Sensitivity Scoring Facilitates the Discovery of Synergistic and Efficacious Drug Combinations in Cancer. PLOS Computational Biology (2019), 15 (5), e1006752 https://journals.plos.org/ploscompbiol/article?id=10.1371/journal.pcbi.1006752
- [W3C Working Group, 2016] W3C Working Group (2016). CSV on the Web: Use Cases and Requirements. https://www.w3.org/TR/csvw-ucr/. Accessed: 2019-02-14.
- [Yadav et al., 2014] Yadav, B., Pemovska, T., Szwajda, A., Kulesskiy, E., Kontro, M., Karjalainen, R., Majumder, M. M., Malani, D., Murumagi, A., Knowles, J., Porkka, K., Heckman, C., Kallioniemi, O., Wennerberg, K., and Aittokallio, T. (2014). Quantitative scoring of differential drug sensitivity for individually optimized anticancer therapies. Sci Rep, 4:5193.
- [Yadav et al., 2015] Yadav, B., Wennerberg, K., Aittokallio, T., and Tang, J. (2015). Searching for Drug Synergy in Complex Dose-Response Landscapes Using an Interaction Potency Model. Comput Struct Biotechnol J, 13:504– 513.
- [Yang et al., 2013] Yang, W., Soares, J., Greninger, P., Edelman, E. J., Lightfoot, H., Forbes, S., Bindal, N., Beare, D., Smith, J. A., Thompson, I. R., Ramaswamy, S., Futreal, P. A., Haber, D. A., Stratton, M. R., Benes, C., McDermott, U., and Garnett, M. J. (2013). Genomics of Drug Sensitivity in Cancer (GDSC): a resource for therapeutic biomarker discovery in cancer cells. Nucleic Acids Res., 41(Database issue):D955–961.
Dataset List #back to top
| Study name | Disease | Data source | Pubmed ID | Number of drugs | Number of blocks | Number of cell lines | Number of tissues | Full dose-response matrix size |
|---|---|---|---|---|---|---|---|---|
|
ONEIL |
Cancer |
Publication |
26983881 |
38 |
92208 |
39 |
6 |
5x5 |
|
CLOUD |
Cancer |
Publication |
28530711 |
283 |
40160 |
1 |
1 |
2x2 |
|
ALMANAC |
Cancer |
Publication |
28446463 |
103 |
311604 |
60 |
9 |
4x4, 4x6 |
|
FORCINA |
Cancer |
Publication |
28601558 |
1818 |
1818 |
1 |
1 |
2x2 |
|
NCATS_ATL |
Cancer |
NCATS Tripod |
22 |
30 |
1 |
1 |
10x10 |
|
|
MATHEWS |
Cancer |
NCATS Tripod |
24469833 |
477 |
1119 |
1 |
1 |
6x6, 10x10 |
|
NCATS_DIPG |
Cancer |
NCATS Tripod |
2450 |
8854 |
2 |
2 |
6x6, 10x10 |
|
|
NCATS_ES(FAKI/AURKI) |
Cancer |
NCATS Tripod |
1909 |
1910 |
1 |
1 |
6x6 |
|
|
NCATS_ES(NAMPT+PARP) |
Cancer |
NCATS Tripod |
94 |
4628 |
4 |
3 |
6x6, 10x10 |
|
|
WILSON |
Cancer |
NCATS Tripod |
30289729 |
31 |
764 |
2 |
1 |
6x6, 10x10 |
|
NCATS_HL |
Cancer |
NCATS Tripod |
1910 |
2694 |
4 |
2 |
6x6, 10x10 |
|
|
YOHE |
Cancer |
NCATS Tripod |
29973406 |
25 |
270 |
3 |
2 |
10x10 |
|
NCATS_2D_3D |
Cancer |
NCATS Tripod |
5 |
70 |
2 |
2 |
10x10 |
|
|
PHELAN |
Cancer |
NCATS Tripod |
29925955 |
16 |
62 |
1 |
1 |
10x10 |
|
NCATS_MDR_CS |
Cancer |
NCATS Tripod |
18 |
68 |
2 |
1 |
10x10 |
|
|
CCLE |
Cancer |
PharmacoDB |
22460905 |
24 |
11670 |
503 |
24 |
6x1, 7x1, 8x1 |
|
CTRPV2 |
Cancer |
PharmacoDB |
26482930 |
544 |
395263 |
887 |
24 |
8x1 ~ 29x1 |
|
FIMM |
Cancer |
PharmacoDB |
24056683 |
52 |
2561 |
50 |
5 |
5x1 |
|
GCSI |
Cancer |
PharmacoDB |
27193678 |
16 |
6455 |
409 |
23 |
8x1, 9x1 |
|
GDSC1 |
Cancer |
PharmacoDB |
23180760 |
250 |
225480 |
1074 |
30 |
5x1, 9x1 |
|
GRAY |
Cancer |
PharmacoDB |
24176112 |
89 |
9413 |
70 |
2 |
9x1 |
|
UHNBREAST |
Cancer |
PharmacoDB |
26771497 |
4 |
52 |
15 |
1 |
9x1, 18x1 |
|
BEATAML |
Cancer |
Publication |
30333627 |
122 |
59348 |
528 |
1 |
7x1 |
|
FLOBAK |
Cancer |
Publication |
31664030 |
19 |
9984 |
8 |
7 |
6x6 |
|
ASTRAZENECA |
Cancer |
AstraZeneca |
31209238 |
116 |
20482 |
153 |
10 |
6x6 |
|
FRIEDMAN |
Cancer |
Publication |
26461489 |
108 |
208008 |
36 |
1 |
3x3 |
|
SCHMIDT |
Cancer |
Publication |
24101737 |
4 |
100 |
5 |
1 |
8x8 |
|
MILLER |
Cancer |
Publication |
24065146 |
13 |
82 |
1 |
1 |
8x8 |
|
FRIEDMAN2 |
Cancer |
Publication |
28446504 |
76 |
28500 |
10 |
1 |
3x3 |
|
TOURET |
SARS-CoV-2 |
Publication |
32753646 |
1516 |
1520 |
1 |
1 |
1x1 |
|
GORDON |
SARS-CoV-2 |
Publication |
32353859 |
75 |
290 |
1 |
1 |
5x1, 6x1, 7x1 |
|
ELLINGER |
SARS-CoV-2 |
ChEMBL |
5604 |
5632 |
1 |
1 |
1x1 |
|
|
MOTT |
Malaria |
NCATS Tripod |
26403635 |
223 |
17072 |
3 |
1 |
6x6, 10x10 |
|
NCATS_SARS-COV-2DPI |
SARS-CoV-2 |
NCATS Tripod |
56 |
206 |
1 |
1 |
6x6 |
|
|
BOBROWSKI |
SARS-CoV-2 |
NCATS Tripod |
32637956 |
34 |
262 |
1 |
1 |
6x6 |
|
DYALL |
Ebola |
NCATS Tripod |
29939303 |
17 |
432 |
2 |
2 |
6x6 |
|
FALLAHI-SICHANI |
Cancer |
Publication |
28069687 |
10 |
111 |
5 |
1 |
10x1, 20x1 |
Tutorial #back to top
We will walk through the main functions of the DrugComb data portal using an example data extracted from “ONEIL” study. The ONEIL data is a pan-cancer drug combination study where 583 drug combinations have been tested across 39 cell lines [O’Neil et.al, 2016]. For each drug combination, four replicates have been produced. We show selective drug combinations that were tested on OCUBM (breast cancer) cell line and treated by Niraparib and MK-1775.
Preparing and uploading data set
We prepared the file for uploading according to the requirement of the input data for “Analysis” function. Please check the section “Example data input” for more details. The table is saved in file “Oneil_example_data.csv” and uploaded to the DrugComb server via the user interface (Fig.1A).While file successfully uploaded, the table will be printed on the web page for user to double check the input (Fig.1B). User could click on the “Analysis” button to continue the process.

Figure1: Upload example data to “Analysis” function. A) The user interface for uploading the drug combination screening file. B) The updated data table.
Analysis results
DrugComb returns the results on a page containing two tabs “Table” (Fig.2A) and “Graph”. The “Graph” tab displays the plots for sensitivity and synergy for the selected combination. Figure 2B and 2C shows the example of the first block in the summary table. By clicking the “Download Results” button at the top-right corner of this page (Fig.2A), user could down load a compressed file for all the results.

Figure2: The results returned by “Analysis” function. A) Summary table for all the blocks in the uploaded data; B) Visualization for the sensitivity level of the block 1; C) Visualization for the interaction degree of the block 1.
Summary table
DrugComb provides the CSS score to evaluate the drug combination sensitivity. For evaluating the drug synergy, we implement four major mathematical models including Bliss, Loewe, HSA and ZIP and an additional S score that is derived from the difference between CSS and RI scores of the combination and single drugs respectively. For more information about these scores, please check the sections “Drug synergy” and “Drug combination sensitivity”.
As shown in the summary table (Fig.2A), the CSS ranges from 70.32 to 90.22 and all the synergy scores (including S, ZIP, Loewe, Bliss, and HSA) are significantly larger than 0. It suggests that combining the MK-1775 and Niraparib inhibits the 70% - 90% of growth on the OCUBM cell line and raising a synergistic effect.
Sensitivity visualization
The box plot in the top-left corner of Figure 2B shows the CSS and S score for all the 4 blocks in the input data. The green and red circles mark the CSS and S scores calculated from the block 1.
The contour level plot in the top-right corner of Figure 2B shows the dose-response map for the block 1. While the two plots in lower row in Figure 2 shows the dose-response curve for MK-1775 and Niraparib.
Synergy visualization
The Figure 2C shows the synergy maps on the full matrix for block 1. The maps suggest that the maximum synergistic effect in this block is reached while 0.775 uM Niraparib and 0.0325 uM MK-1775 was added.
Search in DurComb database
We search the combination of Niraparib and MK-1775 in the DrugComb database (Fig.3). It returns 172 experiments tested in 9 tissue types, including ovary, large intestine, lung … These data could be used to study the responses of different cancer tissues to the treatment of Niraparib and MK-1775.

Figure3: Tissues have the combination of Niraparib and MK-1775